
You are using an out of date browser. It may not display this or other websites correctly.
You should upgrade or use an alternative browser.
You should upgrade or use an alternative browser.
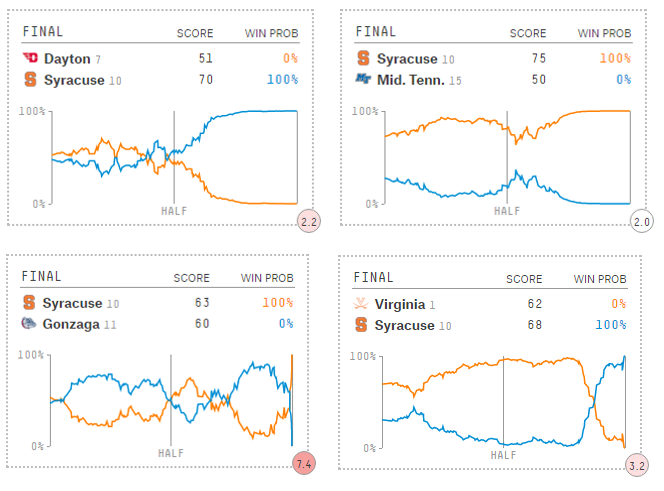
neat winning % graph
- Thread starter terron
- Start date
SUintheVille
Former 'Blue Light Special' Announcer
- Joined
- Sep 4, 2011
- Messages
- 2,845
- Like
- 3,881
Nice graphs. I like when our trend line is above theirs at the end of the game.
sutomcat
No recent Cali or Iggy awards; Mr Irrelevant
- Joined
- Aug 15, 2011
- Messages
- 25,355
- Like
- 109,701
Excitement factor...What is the circle with a number in it at the bottom right corner of each graph?
HoustonCuse
2020-21 Iggy Winner Lead Scorer & Post Season Rcd
- Joined
- Aug 16, 2011
- Messages
- 11,307
- Like
- 25,257
These are from 538 sports. Type that into google and you'll find the site. They have women's analysis too. They give the men's team a 30% chance of beating UNC and an 11% chance of winning the title. Women have something like 68% chance of getting to the final game and a 3% chance of a title (shocked it is that high).
Also they have a nice analytics based article about how Gonzaga was waaaay better than an 11 seed, but that was before we played them so they have probably erased it by now.
Also they have a nice analytics based article about how Gonzaga was waaaay better than an 11 seed, but that was before we played them so they have probably erased it by now.
CaptainJ
Disembodied?
- Joined
- Nov 14, 2011
- Messages
- 8,862
- Like
- 10,269
What is the circle with a number in it at the bottom right corner of each graph?
Other than the Gonzaga game, it reminds me of my likely BAC(multiplied by 10) at the end of the night.
Interesting graphs, and I'm hoping we're at 100% after the next game too! A real time version mightbe even more interesting. Good find.
CaptainJ
Disembodied?
- Joined
- Nov 14, 2011
- Messages
- 8,862
- Like
- 10,269
How did we not have a higher chance of winning when we were up 8-2 on uva?
I imagine the point differential is weighted against the amount of time remaining, and at that point the odds were they were going to outscore us by more than that differential. It would be interesting to see just how late in the game Syracuse would still not be favored to win with a 6 point lead.